Complete List of Projects
ProjectsAccess an organized list of all the projects created.
Turn data from different sources into a clear view of your indicators.
Detect changes, patterns and differences to decide with more context.
Put the findings within reach of the teams that must act on them.
A first look at what you can do with this product.
Gather the indicators of each team into easy-to-read dashboards.
Explore specific questions from different perspectives without redoing the dashboard.
Identify trends, comparisons and territorial differences more clearly.
Use identified sources and gather different origins in the same view.
Share findings and make it easier for other teams to consult the information.
Accompany the graphics with explanations that facilitate their interpretation.
Select a category in the map to explore its features.
Choose a category or search across all product features. Browse the results page by page.
114 features
The search includes all categories.
Access an organized list of all the projects created.
Displays data sources, panels, dashboards, creation and modification dates, author, group, title and description of each project.
All information is organized to facilitate consultation and optimize collaborative work, reducing time spent on manual searches.
This section presents the entity's general statistics, showing the total of sections such as actions, active directory, groups, users, products.
Lists IFINDIT applications purchased by the entity through SaaS licensing and provides flexibility to manage access accurately.
Use encrypted communication by SSL certificate for platform access.
It allows you to configure connections and firewall rules according to the entity's requirements.
Allows connection of networks via VPN Site-to-Site for data intake by an encrypted channel.
Supports user access settings within the organization's private network.
Includes access controls to protect the entity's information.
It allows users to enter the platform using a credentials form.
It allows the user to complete their active session safely, invalidating the current access token and preventing the use of expired sessions.
It offers the user the possibility to reset their password by means of a verification and security confirmation flow, without needing to contact an administrator.
Allows you to create, edit, list and delete organizations.
It facilitates the creation, modification and elimination of user groups.
Within each project, folders group the related resources (Control dashboard and panels).
It represents the specific elements that live within a folder (control dashboard, panels or other types).
Enables the creation, modification and removal of local users in an efficient manner.
Connect with Active Directory to list and manage corporate directory users.
It facilitates the configuration and management of actions assigned to each user role.
The system includes a set of predefined user profiles that align with common roles, allowing quick and efficient incorporation without the need for...
Profiles can be defined according to specific roles or responsibilities within the organization.
User profiles are fully customizable, allowing organizations to adapt accesses, permissions and configurations to their needs and workflows...
Access control and system authorizations are managed through user profiles.
Deleted resources move to a wastebasket before they are permanently deleted.
Simplify the definition and configuration of hierarchical levels within the organization.
It allows you to assign specific functionalities to each hierarchical level.
Allows you to set the maximum duration of active sessions.
It offers the option of activating or deactivating this tool as an additional security measure.
Includes options to modify the platform's color palette.
It allows the management and configuration of multiple organizations or business units within the same instance of the platform.
It allows to share panels and dashboards among users of an organization according to their accesses.
The audit module is enabled by default, allowing for immediate use without additional configurations.
It offers access to thousands of audit events, organized and available for consultation.
It offers filters by interacting with graphics, expanded view, individual links and selection of date ranges.
It allows exporting records and visualizations in PNG, PDF, CSV, Excel, JSON and XML.
Connects IFINDIT Data Catalog sources to panel construction and management.
List and manage data sources connected to IFINDIT Data Catalogue.
It integrates with IFINDIT's data warehouse to consult structured data and build reports.
It allows direct integration with IFINDIT data lake, providing flexible access to unstructured and semi-structured data for advanced analysis and scalability in the...
Supports the import and processing of Parquet files, a columnar storage format optimized for performance in big data workflows and environments in the world.
It allows working with large volume data sets in a source.
It allows combining various data sources in a unified display, facilitating cross-analyses and comprehensive perspectives.
It allows the incorporation of data sets using a web interface.
Includes an interface for writing data cleaning, processing and parameterization instructions.
The system allows you to define and apply custom rules that fit the unique needs of each project.
The application has an interface to write code, designed to clean, transform and parameterize data in detail.
It supports Python, Scala, R and Julia for data analysis and transformation tasks.
It offers a library of graphics, maps and visualizations to build custom panels.
A project is a custom category that groups one or more control dashboards, allowing you to organize and centralize information according to your specific needs.
Filters fields by categories, date ranges, numeric ranges, and text matching.
Each panel can have its own independent filters, configurable from the panel workspace.
It allows complex filtering logic to be constructed using hierarchical groups with logical operators (AND/OR).
In display mode, the user can activate a floating filter panel to modify active values without entering editing mode.
Special type of visual component within the panels that allows you to filter data interactively using a tree or hierarchy selection.
Type of visual component presenting a drop-down or multiple selection list to filter the dashboard data.
Allows you to select date ranges to filter dashboards and analyze specific periods.
The Interactive Control Dashboard is a tool designed to centralize and organize key visualizations by integrating one or more (graphic) panels.
The user can create new Control Dashboard by specifying name, description and initial configuration.
Presents dashboard in read-only mode for information consumption.
Working environment where the user can compose the dashboard by adding, moving, resizing and removing panels.
Each dashboard manages the layout of your panels according to the screen size you want to display with.
Defines the overall behavior of the dashboard: text search, PDF export, background color and grid spacing.
It allows you to associate multiple data sources to a dashboard and manage your connections.
It allows you to record complementary metadata such as reference URL, alternative title and extended description, useful for documenting the purpose of each graph.
It controls whether a dashboard is public or private, and whether it has been published for general consumption.
The dashboard workspace includes a side menu with tabs that allow you to navigate between the panel library, the configuration and the dashboard filters, without leaving the...
It allows to modify the design and layout of the panels on the dashboard.
Configure dashboards to meet specific goals, aligning them with the needs of each area or project.
It allows you to download data from a control dashboard in PDF, CSV and Excel.
It generates graphic panels from materialized views integrated into the platform.
The user can create a new panel by defining its title, description and chart type.
Visual environment dedicated to the design and complete configuration of a panel.
From the workspace, the user chooses the desired display type of a graphics library.
Defines how the data is recovered for the panel: data source, selected fields, record limit, sorting rules and applied filter groups.
Shows the visual result of the panel settings in real time before saving.
Centralized view of all available panels within a project, organized by folders.
Allows you to remove a panel permanently or disassociate it from a specific dashboard.
The user can export the display of the panel as a file.
Check whether a panel is public or private, and whether it has been published for general consumption.
Design and adjust graphic panels in a simple way.
Each panel offers an understandable visual representation, ideal for converting data into actionable information, even for users with limited technical experience.
Adapt colors, formats and graphics structures to reflect the objectives of the analysis.
Graphics are designed to provide a useful and accurate perspective, becoming an indispensable tool for strategic data analysis.
Allows you to change the chart type and adjust your presentation.
It generates a link to open each chart individually or integrate it into other systems.
It generates interpretations in natural language for the graphs selected by artificial generative intelligence.
Allows you to expand a chart to view its details.
Allows you to create, edit, list and remove custom color palettes.
Each palette contains a set of individual colors defined in hexadecimal format.
Defines the way in which the colors of a palette are assigned to the elements of a graph (by category, gradient, value, etc.).
From the panel workspace, the user can define specific colors for individual elements of a graph, complementing or overlaying the general palette.
Reusable interface elements that are added to a panel to control specific aspects of your display (heads, color configurations,...
Configure components with text, URL, integer, color, boolean, list and shadow values using visual controls.
Specific elements of each type of graph that allow you to adjust your visual appearance and behavior in more detail (e.g., axes, legends, labels, margins, animations, etc.).
Stores the values of each configuration parameter in the graph.
Defines the configurable parameters for each type of graph.
Group the types of graphs into logical categories to facilitate their exploration and selection.
Defines dimensions and measurements with aliases and counting operations, sum, average, minimum and maximum.
It includes horizontal and vertical bars, simple, grouped, stacked and with various fields.
Includes areas, series lines, time series and stacked lines.
Includes circular, ring and solar graphics.
It includes maps of Colombia and Bogotá, departments, municipalities, localities, sub-networks, UPZ and polygon filters.
It includes simple, multicolumn tables, branched, nested and with conditional format.
Includes Marimekko, indicators, funnels, meters, waterfalls, calendars, heat maps, pyramids, radar, Sankey, waffle and financial graphics, among other visualizations.
It allows you to obtain information from the available data sources registered in the external catalogue.
Recovers the available fields from a data source in the catalog so that the user can select them when constructing a panel query.
Shows the user, within the dashboard or dashboard context, detailed information about associated data sources, including tooltips and metadata relevant to...
It presents the general data of the IFINDIT Dashboards platform: institutional version, description and logos.
Lists all open source software units used on the frontend and related services, with their respective license.
We didn't find features with those terms. Try a different word.
See the technical conditions and part numbers of the product.
See Part NumbersIFINDIT DASHBOARD turns your organization's data into clear indicators to detect trends, share findings and make decisions with more context.
Explore how it relates to other products and shared capabilities.
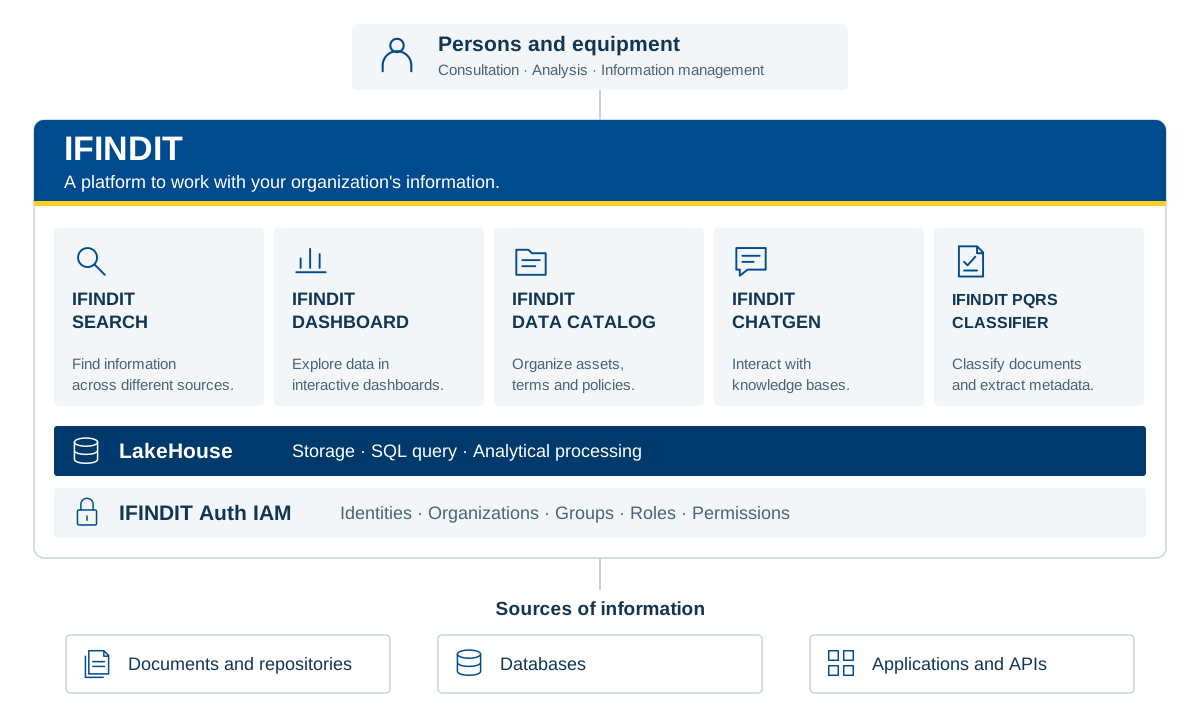
Consultation · Analysis · Information management
Documents and Repositories · Databases · Applications and APIs
A functional view of IFINDIT and its shared capabilities. Each product connects different needs of the organization.
View platform architecture (SVG)Tell us what you need to find, analyze or organize. Discover IFINDIT with the Creangel team.